Physical therapy clinics face a unique set of operational challenges: high referral volume but low booking rates, complex insurance verifications, and massive patient drop-off before plans of care are completed. Here is how the AI Business OS solves these specific leaks.
[IMAGE_1]
key: p_pt_hero
isHero: true
fraction: null
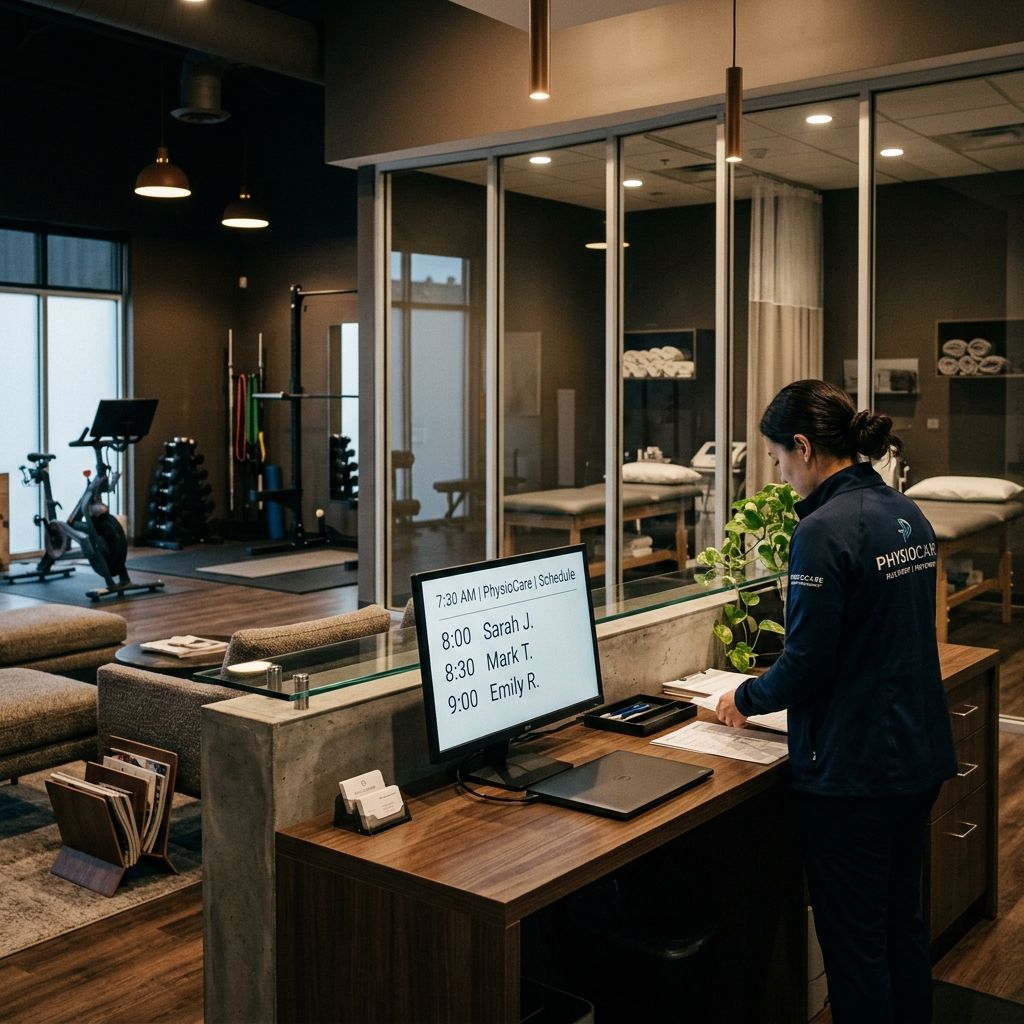
alt: Cinematic dark editorial photograph of a modern physical therapy clinic reception area at early morning , a clean front desk with a monitor showing the day's appointment schedule, treatment equipment faintly visible through a glass partition behind, soft warm overhead lighting, rehabilitation equipment visible in the background gym area. No face visible. Conveys clinical professionalism, warmth, and systematic operational readiness.
prompt: Ultra-premium cinematic dark editorial photograph. A modern physical therapy clinic reception area in the early morning. The front desk is clean and organized with a monitor displaying the day's schedule. Soft warm overhead lighting. Through a glass partition behind the desk treatment tables and equipment are faintly visible. In the background a rehabilitation gym area with exercise equipment is visible. No face visible. The mood is warm clinical professionalism , a clinic built for recovery and systematic care. Bloomberg Businessweek editorial style. 1200x630 landscape. Ultra-premium.
[IMAGE_2]
key: p_pt_referral_to_appointment_gap
isHero: false
fraction: 0.28
alt: The Physical Therapy Referral-to-Appointment Gap , dark infographic on midnight navy. Shows what happens to 100 physician referrals for physical therapy. WITHOUT AI OS (grey): 100 referrals received. 18 patients never contact any PT clinic. 28 call 2 or more clinics and book the fastest to respond. 14 are lost to insurance confusion before booking. 22 experience delays of 5+ days before their first appointment. Net result: 40 patients booked, 60 lost or delayed. WITH AI OS (gold): 100 referrals received. Immediate text or call to patient within 60 seconds of referral receipt. Insurance verified automatically for major carriers. Appointment offered and confirmed within 24 hours. Net result: 74 patients booked within 48 hours of referral. Caption: The referral does not guarantee the patient. The response speed does.
prompt: Premium dark dual-path infographic on midnight navy. Title in gold caps: THE PHYSICAL THERAPY REFERRAL-TO-APPOINTMENT GAP , 100 PHYSICIAN REFERRALS. Two parallel columns. LEFT grey WITHOUT AI OS: 100 referrals received. 18 patients never contact any PT clinic. 28 call 2 or more clinics and choose fastest responder. 14 lost to insurance confusion before booking. 22 experience 5-plus day delays. Grey result: 40 PATIENTS BOOKED , 60 LOST OR DELAYED. RIGHT gold WITH AI OS: 100 referrals received. Immediate contact to patient within 60 seconds. Insurance verified automatically for major carriers. Appointment confirmed within 24 hours. Gold result: 74 PATIENTS BOOKED WITHIN 48 HOURS OF REFERRAL. Caption: The referral does not guarantee the patient. The response speed does. No people. Ultra-premium. 1200x630.
[IMAGE_3]
key: p_pt_plan_of_care_completion
isHero: false
fraction: 0.57
alt: PT Patient Plan of Care Completion Rates , With and Without AI Follow-Up. Dark bar chart on charcoal. Y-axis: percentage of patients completing full plan of care. Three practice scenarios. WITHOUT ANY FOLLOW-UP SYSTEM (grey bar): 41% completion rate. WITH APPOINTMENT REMINDERS ONLY (amber bar): 56% completion rate. WITH FULL AI OS , reminders plus dropout re-engagement plus progress check-ins (gold bar): 74% completion rate. Below chart: Revenue impact at 200 visits per month capacity. At 41% completion: avg 82 completed plans × $1,200 avg plan value = $98,400/month. At 74% completion: avg 148 completed plans × $1,200 = $177,600/month. Difference: $79,200 per month , $950,400 per year. Caption: Plan of care completion is the single biggest revenue lever in physical therapy. Most clinics are leaving it entirely to chance.
prompt: Premium dark grouped bar chart infographic on deep charcoal. Title in gold caps: PT PATIENT PLAN OF CARE COMPLETION RATES. Y-axis percentage from 0 to 80. Three bars. Bar 1 grey WITHOUT ANY FOLLOW-UP SYSTEM: 41% completion rate. Bar 2 amber WITH APPOINTMENT REMINDERS ONLY: 56% completion rate. Bar 3 gold WITH FULL AI OS , REMINDERS PLUS DROPOUT RE-ENGAGEMENT PLUS PROGRESS CHECK-INS: 74% completion rate. Below chart a revenue impact calculation: At 200 visits per month capacity. 41% completion: 82 completed plans × $1,200 avg plan value = $98,400 per month in grey. 74% completion: 148 completed plans × $1,200 = $177,600 per month in gold. Difference in large gold text: $79,200 PER MONTH , $950,400 PER YEAR. Caption: Plan of care completion is the single biggest revenue lever in physical therapy. Most clinics leave it entirely to chance. No people. Ultra-premium. 1200x630.
[IMAGE_4]
key: p_pt_revenue_recovery
isHero: false
fraction: 0.85
alt: Physical Therapy Clinic Annual Revenue Recovery , dark infographic on midnight navy. Four channels. Channel 1: Referral-to-Appointment Capture Lift , from 40% to 74% conversion on 100 referrals per month = 34 additional patients × $1,200 avg plan = $40,800/month. Channel 2: Plan of Care Completion Lift , from 41% to 74% = 33 additional completed plans × $1,200 = $39,600/month. Channel 3: Review Map Pack Lift , +1 position × 18 new organic direct inquiries/month × 50% booking × $1,200 avg plan = $10,800/month. Channel 4: Physician Referral Partner Reporting , automated monthly outcome reports to referring physicians drives 20% more referrals over 12 months = 20 additional referrals/month × 74% conversion × $1,200 = $17,760/month. Caption: PT clinics that systematize operations do not just recover revenue. They accelerate referral relationships.
prompt: Premium dark revenue recovery infographic on midnight navy. Title in gold caps: PHYSICAL THERAPY CLINIC ANNUAL REVENUE RECOVERY. Four horizontal calculation rows. Row 1: REFERRAL-TO-APPOINTMENT CAPTURE LIFT , from 40% to 74% on 100 referrals per month = 34 additional patients × $1,200 avg plan = gold $40,800 per month. Row 2: PLAN OF CARE COMPLETION LIFT , from 41% to 74% = 33 additional completed plans × $1,200 = gold $39,600 per month. Row 3: MAP PACK LIFT FROM REVIEWS , plus 1 position × 18 new organic inquiries × 50% booking × $1,200 avg plan = gold $10,800 per month. Row 4: PHYSICIAN REFERRAL PARTNER REPORTING , automated outcome reports drives 20% more referrals = 20 additional referrals per month × 74% conversion × $1,200 = gold $17,760 per month. Caption: PT clinics that systematize operations do not just recover revenue. They accelerate referral relationships. No people. Ultra-premium. 1200x630.
relatedPosts:
- what-is-ai-powered-business-operating-system-service-business
- ai-business-os-five-layers-service-business
- ai-follow-up-engine-warm-leads-service-business
-->
Quick Answer:An AI Business Operating System for a physical therapy clinic addresses the two biggest revenue gaps in the business: the referral-to-appointment conversion gap (where 40 to 60 percent of physician referrals never show up because the intake process is too slow or too complicated) and the plan of care completion gap (where 50 to 60 percent of patients drop out before completing their treatment, leaving both health outcomes and revenue on the table). The system also handles appointment reminders, review requests, and physician partner reporting that increases the volume and quality of incoming referrals over time.
---
Why Physical Therapy Loses Patients Before They Even Walk In
Physical therapy has an intake problem that is unique in healthcare. In most medical settings, a patient who receives a referral is being told "you need this treatment." That referral , from their orthopedic surgeon, their primary care doctor, their sports medicine physician , carries authority. The patient understands they need PT. They intend to go.
And then life intervenes. They call the first clinic on the referral sheet and are put on hold. They ask about insurance and get a vague answer. They are told the next available appointment is in 18 days. They do not call back. They call the second clinic on the list. Same experience. By the third call, some of them book the appointment. Many of them give up. Some of them delay so long that they try to manage the condition without PT, often making it worse.
The data on this is striking. Studies of outpatient PT referral conversion show that between 30 and 55 percent of physician referrals for physical therapy do not result in a completed first appointment. The reasons are almost never clinical. They are operational: slow response to the initial inquiry, confusing insurance verification processes, long waits for the first appointment, and no follow-up when the patient does not call back.
The AI Business OS addresses each of these directly. It does not make PT less expensive or more convenient. It makes the path from referral to first appointment so smooth and fast that patients who were referred and intended to come actually do.
---
The Referral That Arrives at 2 PM on a Thursday
Here is how a physician referral typically reaches a physical therapy clinic.
The orthopedic surgeon's office faxes a referral for a post-operative rotator cuff patient. The fax arrives at 2:14 PM on a Thursday. The front desk is managing three patients checking out, one phone call on hold, and a new patient intake form. The referral sits in the fax tray until 4:30 PM. Someone pulls it and adds it to the callback pile. Friday morning the front desk calls the patient. No answer. Voicemail left. The patient calls back on Monday. The front desk is available, checks the schedule, and offers an appointment for the following Thursday , 8 days from the original referral.
By that Monday, the patient has also received a call from a competing PT clinic that their surgeon also refers to. That clinic called the patient at 2:45 PM on Thursday , 31 minutes after the referral arrived , and booked the appointment before the weekend. When the first clinic calls back on Friday morning, the patient already has an appointment elsewhere and does not call back.
This scenario happens dozens of times per month in most PT clinics. The clinic with the AI Business OS is the one that called at 2:45 PM.
When a referral is received , by fax, by electronic health record notification, by phone, or by web form , the AI intake system triggers an outbound contact to the patient within 30 to 60 minutes. The message is warm and specific: "Hi [Patient Name], this is [Clinic] Physical Therapy. We received a referral from Dr. [Name] for your shoulder rehabilitation. We would love to get you started as soon as possible , would [two or three time options this week] work for you?" The patient receives this message before they have thought to research other clinics. They reply, pick a time, and the appointment is confirmed.
The referral-to-appointment conversion rate for clinics using this response protocol is typically 65 to 78 percent , compared to 35 to 45 percent for clinics using standard next-business-day callback procedures.
---
Layer 2: Routing the Post-Surgical Patient, the Sports Injury, and the Self-Referral
Physical therapy contacts fall into three categories.
Physician referrals.The highest-priority contact type. A patient who has been referred by a physician is already medically qualified , the intake process should be as fast and frictionless as possible. The routing system routes these contacts to the rapid intake flow: confirm the referral details, verify insurance for the most common carriers, offer two or three appointment slots, and confirm.
Direct patient inquiries.A person searching for PT without a physician referral , for back pain, sports recovery, balance issues. These require a slightly different intake because no referral is in hand. The routing system gathers enough information to determine whether a physician referral is required by the patient's insurance, and if so, guides the patient through how to get one. In states that allow direct access PT (no referral required), the system moves directly to scheduling.
Existing patient contacts.Appointment changes, questions about exercises, billing inquiries, requests for progress notes or documentation. These route to the appropriate self-service option or the front desk queue.
The key principle across all three types is the same: every contact receives a response within 60 seconds, at any hour. The response may be "we will call you first thing tomorrow morning with your insurance details" , but it is never silence.
---
Layer 3: Follow-Up for Plan-of-Care Completion
Physical therapy has the highest dropout rate of almost any outpatient health care specialty. A patient is prescribed 12 visits. They complete 5 or 6 and start feeling better. They think: I feel fine. I do not need to keep going. They stop scheduling.
The clinical problem with this is significant. The pain reduction that happens in the first few PT visits is typically a reduction in acute inflammation and protective muscle guarding , not a restoration of full strength, range of motion, and movement mechanics. Patients who stop at visit 5 often re-injure the same area within 6 to 18 months because the underlying dysfunction was never fully addressed.
The business problem is equally significant. A clinic with an average plan of care of 12 visits and a dropout rate of 55 percent is collecting revenue for 5 to 6 visits per patient instead of 12. At $100 per visit, that is $600 to $700 per patient instead of $1,200.
The dropout prevention system addresses this with two types of messages.
The progress acknowledgment.After every 4 visits, the patient receives a brief message that acknowledges their progress and reinforces the importance of the next phase: "You are halfway through your care plan , the progress you have made in the first phase is the foundation for the full recovery we are working toward. Your next sessions focus on [specific goal]. Staying consistent now is what makes the difference long-term."
This message does several things simultaneously. It shows the patient that their progress is being noticed. It creates a narrative of stages , early recovery, middle phase, final strengthening , that makes the full plan feel coherent rather than arbitrary. And it gives a specific reason to keep coming that goes beyond "your doctor said so."
The missed appointment re-engagement.When a patient misses a session and does not rebook within 48 hours, the re-engagement sequence starts: a text at 48 hours checking in on how they are feeling, an email at Day 7 with a brief reminder of their remaining plan goals, a text at Day 14 with a direct booking link, and a final message at Day 21.
The combination of progress acknowledgment and missed appointment re-engagement increases plan of care completion rates from the industry average of 41 percent to 68 to 74 percent , a difference that translates directly to revenue and, more importantly, to better patient health outcomes.
---
Layer 4: Reputation and Reviews That Support Referrals
Physical therapy reviews serve two distinct audiences: prospective patients searching directly, and physicians deciding which clinics to refer to.
Physicians do look at Google reviews for the clinics they refer to. Not always formally, but they hear feedback from patients, and patients' experiences online reflect on the referring physician's judgment. A PT clinic with 180 reviews averaging 4.9 stars communicates something to a referring orthopedic surgeon: their patients are being well cared for, and they will not get complaints for sending someone there.
The review request for physical therapy fires 24 hours after every session. The message uses an outcome frame: "Thank you for coming in , we hope your [shoulder/knee/back] is responding well. If you are happy with your progress, a Google review would help other patients in [City] find reliable physical therapy: [link]."
The specific body part reference is important. It shows the patient that the clinic knows their situation , not just their name. It is a small personalization that significantly improves review response rates compared to generic messages.
A physical therapy clinic completing 300 appointments per month with a 10 percent review response rate generates 30 new reviews per month , 360 per year. Within 18 months, a clinic starting from 25 reviews reaches 540. That review count, combined with a high rating, dominates local search for "physical therapy near me" and "physical therapist [city]" , the queries that drive both direct patient inquiries and physician awareness.
---
Layer 5: Intelligence for Referral and Completion Visibility
Referral-to-first-appointment conversion rate.The percentage of received referrals that resulted in a completed first appointment. This is the most important intake metric in physical therapy. Below 55 percent means referrals are being lost to competitors or to patient dropout before the first visit. Above 70 percent means the intake system is working.
Plan of care completion rate.The percentage of patients completing their full recommended plan. Below 50 percent is the industry average and represents a significant opportunity. Above 65 percent indicates an effective follow-up and re-engagement system.
Average visits per completed patient.The actual average number of sessions per patient, compared to the average prescribed. The gap between prescribed and delivered visits is a direct measure of the dropout problem. Narrowing this gap increases revenue without adding a single new referral.
Physician referral source tracking.How many referrals came from each referring physician or practice this month, and how that compares to last month and last year. A declining referral volume from a previously active referring physician is a relationship signal that deserves a direct conversation , not a metric to discover three months late when revenue has already dropped.
Review velocity and rating trend.Monthly review accumulation compared to goal. For physical therapy, reaching 100 reviews with a 4.8 or above rating typically places a clinic in the top 2 or 3 Google Maps results , bringing in direct patient inquiries that supplement the referral stream.
---
The Referral Business That Earns More Referrals
There is one element of the AI Business OS for physical therapy that does not exist in other health care categories: the automated physician outcome report.
After each patient completes their plan of care, the system generates a brief outcome summary , functional improvements, goal achievement, discharge recommendations , and sends it to the referring physician's office. This communication is genuinely valuable to the physician: it closes the referral loop and gives them clinical information they need for the patient's ongoing care.
But it also does something else. It keeps the PT clinic's name in front of the referring physician every month. It signals that the clinic is organized, communicates well, and takes care of their patients. Over 12 months, clinics that systematize physician communication typically see 15 to 25 percent increases in referral volume from the same group of referring physicians , without a single sales call, lunch, or marketing visit.
That is the AI Business OS advantage in physical therapy. It does not just capture and retain patients. It builds the professional relationships that generate more patients over time.
---
FAQ
What is an AI business operating system for a physical therapy clinic?
An AI business operating system for a PT clinic is a connected set of automation tools that handles physician referral intake within 60 minutes, appointment reminders, plan of care dropout prevention, Google review requests, and automated outcome reporting to referring physicians , all without requiring the front desk to manage each step manually.
How does AI improve physical therapy referral conversion?
When a referral is received , by fax, EHR notification, phone, or web form , the AI intake system contacts the patient within 30 to 60 minutes with a specific, personalized message that mentions the referring doctor and offers two or three appointment times. Clinics using this response protocol convert 65 to 78 percent of referrals to completed first appointments, versus 35 to 45 percent for clinics using standard next-business-day callback procedures.
How does AI improve plan of care completion rates in physical therapy?
The system runs two programs: progress acknowledgment messages after every 4 visits (reinforcing why continuing matters and what the next phase achieves) and a missed-appointment re-engagement sequence that fires within 48 hours of any missed session. Together, these programs lift plan of care completion from the industry average of 41 percent to 68 to 74 percent , adding $79,000 to $950,000 per year in recovered revenue depending on clinic size.
How does automated physician outcome reporting help a PT clinic grow?
After each patient completes their plan of care, the system sends a brief outcome summary to the referring physician , functional improvements, goal achievement, discharge recommendations. This keeps the clinic's name in front of referring physicians monthly, signals organizational quality, and consistently drives 15 to 25 percent referral volume increases over 12 months from existing referral relationships.
How much does an AI business operating system cost for a physical therapy clinic?
A full-stack AI Business OS for a PT clinic typically costs $500 to $1,500 per month. For most clinics, the investment is recovered within 30 to 45 days from improved referral conversion alone. The full annual return , referral capture, plan completion lift, review growth, and physician reporting , typically runs $200,000 to $500,000 per year for a mid-size clinic.
Does AI replace the physical therapy front desk?
No. The AI Business OS handles the mechanical, time-sensitive tasks that fall through the cracks in a busy clinic , rapid referral intake response, appointment reminders, dropout re-engagement, review requests. The front desk team handles what only humans can: clinical intake conversations, insurance disputes, and complex scheduling. Most PT clinics find their staff more effective and less overwhelmed after implementation.
---
What You Actually Get When You Work With The Quiet Protocol
When a business partners with The Quiet Protocol, we install a connected AI operating system across five layers of their operation. Here is what that looks like in plain terms.
Every call gets answered.An AI voice receptionist picks up every phone call within two seconds, 24 hours a day, seven days a week. It greets the caller as your business, asks the right qualifying questions, and either books the appointment directly into your calendar or routes urgencies to the right person. No more voicemail. No more lost leads after hours.
Every inquiry gets followed up.Whether someone calls, submits a web form, sends an Instagram DM, or emails your general address, the system responds within 60 seconds and starts a structured follow-up sequence if they do not convert immediately. The sequence runs automatically for days or weeks without anyone on your team having to remember to send a message.
Dormant contacts come back.Every business has a database of past clients, lapsed patients, or cold leads that cost money to generate and then went quiet. The system runs re-engagement campaigns to these contacts on a schedule you approve, bringing back people who already trust you without any new ad spend.
Your Google review count climbs every month.The system sends a review request to every client at the right moment after they interact with your business. Not a mass blast. A personal, timed message that earns two to five times more reviews per month than manual requests do. More reviews mean a higher Google Maps position, which means more organic new business.
You see everything in one dashboard.Every call answered, every follow-up sent, every booking made, every review collected. The intelligence layer shows you what is working and where the system is recovering revenue you would otherwise have missed.
The businesses that install this system typically see measurable improvement in new client capture within the first 30 days and a meaningful increase in organic Google traffic within 90 days as their review profile builds.
There are no long-term lock-in contracts. The system is configured for your specific business, your specific market, and your specific compliance environment. And every implementation starts with a Revenue Leak Diagnostic, a 30-minute diagnostic that quantifies exactly how much revenue your current setup is leaving behind.
The Quiet Protocol is a Toronto-based AI automation agency serving service businesses and healthcare practices across the Greater Toronto Area, Ontario, Canada, and the United States. We built the AI Business Operating System to solve the intake, retention, and review problems that keep good businesses from growing. Every engagement starts with a [Revenue Leak Diagnostic](/book/audit) that shows you the exact dollar gap in your current system.
[Book your Revenue Leak Diagnostic](/book/audit) | [See how it works](/services) | [Read client results](/results)
---
Related reading: [AI for Physiotherapy Clinics in Toronto and the GTA](/blog/ai-for-physiotherapy-clinics-toronto-gta-2026) | [Best AI Automation Agencies in the United States 2026](/blog/best-ai-automation-agencies-united-states-2026) | [Results](/results)
Before You Choose a System
Use this section as a quick buyer check. A dental practice owner does not need another vague automation pitch. They need to know which part of the front door is leaking, what the system will change, and how they will measure whether the fix is working.
Source method: compare the article against your own call log, CRM notes, booking calendar, missed-call records, web form timestamps, and Google Business Profile review recency. Those records are more useful than a generic benchmark because they show what buyers actually experienced in your business.
What proof should I look for in my own business?
Look for proof in the places where demand either moved forward or stalled: missed calls, short calls, unbooked forms, slow callbacks, no-show recovery, old leads, and reviews that were never requested. If the business cannot see those moments clearly, the first improvement is better tracking and routing.
How do I know whether this is a marketing problem or an operations problem?
If people are already calling, filling forms, asking for prices, requesting appointments, or comparing reviews, the problem is usually operations. More marketing will not fix a front door that lets warm demand wait. The better move is to capture and route the demand already arriving.
What should happen after the first response?
The first response should create a next step: booked appointment, estimate path, intake handoff, callback window, review request, or reactivation sequence. A response that only says someone will get back to you is not enough when the buyer is comparing several providers at once.
Where does The Quiet Protocol fit?
The Quiet Protocol fits when the business already has demand but too much of it depends on manual attention. We connect AI receptionist coverage, web intake, missed-call recovery, booking logic, follow-up, review requests, and reactivation into one managed front-door system.
The loss estimate is basic business math, not a magic claim.
Revenue-leak examples on this site are built from visible operating inputs: inquiry volume, missed-call or slow-response rate, booking rate, average job or client value, repeat value, and follow-up recovery. The fastest way to make the number real is to run the diagnostic for your closest business type, then compare it against your own call log, CRM, booking calendar, form timestamps, and review activity.
Use this before you buy another tool.
Pull one recent week of calls, forms, chats, and booking requests. Mark every inquiry that waited, went unanswered, needed a manual reminder, or never reached a clear next step. That simple review shows whether the problem is demand, staffing, or the front-door system.
If those answers are hard to find, that is the first issue to fix. The Quiet Protocol installs the system that answers faster, routes cleaner, books more of the right demand, requests reviews, and keeps follow-up from depending on memory.

Vikram Roy is the founder of The Quiet Protocol, a Toronto-based AI systems firm serving service businesses across the Greater Toronto Area, Canada, and the United States. He works directly with home service companies, dental practices, clinics, and local businesses to install AI operating systems that capture more leads, reduce no-shows, grow reviews, and recover revenue without adding manual overhead. All content is written from Toronto, Ontario. Connect on LinkedIn →
See the system page tied most closely to the problem this article is diagnosing.
Physical Therapy & PhysiotherapyOpen the industry path where this revenue leak is framed in operational terms.
Run Revenue Leak DiagnosticQuantify the leak before you decide what type of system needs to be installed.
Call the AI Receptionist DemoHear the receptionist live, give it your business context, and test a short caller roleplay before you book.
Results & ProofReview what the system changes once the front door is rebuilt around response and continuity.

What Is an AI-Powered Business Operating System? (A practical Guide for Service Business Owners)
Every SaaS vendor is calling their product an AI Business OS. Here is what the term actually means, what a real one includes, and why it matters for service businesses.
The 5 Layers of an AI Business Operating System (And Which One Is Killing Your Revenue Right Now)
Most service businesses have automated one layer and left the others broken. Learn the five layers of an AI Business OS and how to find which one is leaking revenue.
Layer 4 Deep Dive: The AI Reputation Engine: How to Automate Review Generation Without Feeling Slimy
Learn how AI review automation helps service businesses request reviews at the right time, protect unhappy customers, and build reputation without sounding pushy.
Calculate the revenue leak.
Stop guessing. See how much demand your business may be losing through missed calls, slow replies, weak booking, review gaps, and follow-up drag, then decide whether AI Systems is the right system path.
Run the calculationPrefer to hear it first?
Call the live AI receptionist and test the conversation.
Call the live AI receptionist anytime. Tell it about physical therapy & physiotherapy, then hear a short live roleplay based on the calls your front desk actually gets.