
Turn your own call records into a decision-ready report for response, booking, staffing, follow-up, and customer handoffs.
This article links to 4 external sources beside the claims they support.
Your call log is not a sales total. It is a record of customer demand moving through an operating system. The useful question is not simply how many calls arrived. It is what each eligible inquiry needed, which path it entered, how the business responded, who owned the next action, and where the outcome became known or disappeared.
That distinction matters because raw call counts mix together new inquiries, existing-customer questions, vendors, wrong numbers, duplicate attempts, spam, outbound calls, and internal transfers. A total can look healthy while qualified buyers wait, call twice, receive no next step, or leave the business without a final disposition.
This guide shows how an established service business can turn its own phone records into a decision-ready operating report. It does not ask you to trust a borrowed conversion rate or a universal response target. Your service mix, hours, capacity, urgency, geography, and customer expectations set the relevant boundary.
The U.S. Small Business Administration frames management as a connected set of day-to-day responsibilities, including operations, employees, finance, compliance, emergency preparation, cybersecurity, and AI. Its business management guidance is a useful reminder that call handling is not an isolated phone feature. It affects staffing, customer experience, scheduling, risk, and revenue.
The short answer: follow each eligible inquiry to a final disposition
A decision-ready call report answers six questions. Was this a real customer inquiry? Which answer path did it receive? How long did the next useful response take? What was the disposition? Who owned the next action? What finally happened?
If one of those answers is unknown, record Unknown. Do not convert missing evidence into a lost-sale claim. Unknown is valuable because it exposes the exact place where the business stops learning from its own demand. The first improvement may be better call tagging, not a new answering system.
A call log becomes business intelligence only when the business can connect contact, response, ownership, and outcome.
Build the record before interpreting the pattern
Start with a representative period that includes ordinary demand. Export the phone history and connect it, where possible, to booking, calendar, CRM, estimate, and customer records. Use company records as the source of truth. A dashboard label such as answered or completed may not tell you whether the customer received a useful next step.
The worksheet below defines the minimum operating record. It is intentionally small enough to use in a spreadsheet and complete enough to guide a real decision. Sample manually before attempting a full historical analysis. The quality of the definitions matters more than the size of the export.
Call-log fields include Eligible inquiry, Answer path, Response interval, Disposition, Next action ownership, and Final outcome.
Give every eligible inquiry a path, owner, and final outcome.
Use the same definitions across a representative sample. When the record is incomplete, mark the field Unknown and repair the evidence path before making an economic claim.
- FIELD 01
Eligible inquiry
Was this a prospective or returning customer asking for a service the business could reasonably provide?
Record: new inquiry, returning customer, support, vendor, spam, wrong number, duplicate
- FIELD 02
Answer path
What did the caller actually reach, including transfers, fallback, abandonment, voicemail, or an automated path?
Record: staff, voicemail, AI, abandoned, transferred, failed, unknown
- FIELD 03
Response interval
When did the first useful response occur, not merely a ring, generic acknowledgement, or system event?
Record: contact time, useful-response time, after-hours flag
- FIELD 04
Disposition
What did the business know after the interaction, and was the request ready to book, follow up, decline, or review?
Record: booked, qualified follow-up, not fit, capacity, price, no decision, unknown
- FIELD 05
Next action ownership
Which person or workflow owned the promised next step, by when, and with what current status?
Record: owner, due time, open, completed, overdue, cancelled
- FIELD 06
Final outcome
Did the journey become completed work, a known loss, an unresolved inquiry, or a repeat contact?
Record: completed, lost reason, unresolved, repeat contact, unknown
Choose the response that matches the failure.
The call log should narrow the decision. It should not become a reason to buy the largest system.
Repair a staff rule
The right person received the inquiry but lacked authority, context, or a clear next step.
Clarify the decision right, script, or handoff before buying more software.Configure the platform
The path is standard, but assignments, reminders, statuses, or visibility are inconsistent.
Connect the agreed pipeline, calendar, form, task, and standard automation.Improve website intake
Callers repeatedly ask questions the website should answer or choose the wrong service path.
Clarify positioning, service selection, qualification, and booking on the website.Add bounded AI intake
Eligible calls arrive outside coverage or during overflow, and the allowed response can be defined safely.
Set the answer, capture, routing, booking, escalation, and fallback boundary.Install a custom system
The customer journey crosses multiple channels, rules, roles, campaigns, or business-specific exceptions.
Map and test the full path from inquiry through team handoff and final disposition.
Analysis boundary: Minimize sensitive information, restrict access, define retention, and use recordings only where lawful and appropriate. The report should contain the least customer data needed for the operating decision.
Field 1: define an eligible inquiry
Raw call volume is not customer demand
An inbound line can receive sales inquiries, existing-customer updates, staff calls, vendors, recruiters, wrong numbers, spam, duplicate attempts, and calls that belong to another location. Treating every row as a lead inflates demand and makes missed-call economics unreliable.
Write a simple eligibility rule. An eligible inquiry may be a new or returning customer asking for a service, location, timing, and situation the business could reasonably serve. Keep support and administrative calls visible, but analyze them separately because they create different staffing and self-service opportunities.
Filter without erasing useful friction
Do not delete duplicate attempts merely because they share a phone number. Link them to the same journey. A second call may reveal that the first path did not resolve the request. At the same time, do not assume every repeated number represents customer frustration. It may be a planned callback, a family member, a property manager, or a multi-site account.
Unwanted and spoofed calls are a real part of phone data. The Federal Communications Commission explains its work on unwanted calls, texts, and caller ID spoofing. That is one reason a business should not treat an unclassified phone-system total as a count of buyers.
Field 2: map the answer path
Answered does not always mean helped
A call may be marked answered when it reached a staff member, an answering service, an automated prompt, a transfer destination, or a recording. The operating question is what the caller experienced. Did someone understand the request, provide a truthful next step, capture the required context, and route the work?
Use a small set of answer-path labels that reflect the real operation: staff answered, voicemail, AI answered, abandoned before connection, transfer completed, transfer failed, or unknown. If overflow and after-hours calls behave differently, keep those dimensions as separate fields instead of hiding them inside one label.
Sample the experience, not only the status
Choose examples from different days, hours, staff members, and outcomes. Review notes and recordings only when lawful and appropriate. A sample can expose vague promises, repeated questions, transfers without context, scheduling uncertainty, or a system that collects data but never creates an owned action.
If phone intake is the weak path, compare the current experience with a bounded AI receptionist. The right test is not whether the voice sounds impressive. It is whether the system can handle the approved customer scenarios, admit its limits, escalate correctly, and leave usable context for the team. The live AI demo lets a buyer test the interaction before scoping the business rules.
Field 3: measure the first useful response
Use timestamps, not a universal target
Record when the inquiry arrived and when the customer received a useful response. Useful may mean an appointment, an approved callback window, emergency routing, a request for a necessary document, or a clear explanation that the business is not a fit. A generic text that says someone will respond soon may acknowledge the inquiry without advancing it.
Interpret the interval within context. A restoration emergency, a dental consultation, a commercial maintenance request, and a bookkeeping cleanup inquiry do not share the same urgency or decision process. Compare like with like: service type, urgency, day, hour, location, and staffing condition.
Separate wait time from capacity
A fast response cannot create unavailable capacity. If the business is full, the useful response may be an honest next opening, a waitlist, a referral, or a decline. Record capacity as a disposition so the owner does not blame intake for a scheduling constraint or buy more demand that the operation cannot fulfill.
The Revenue Leak Diagnostic can model directional response and booking friction. Replace its assumptions with company records before using the result for staffing, investment, or revenue planning.
Field 4: require a disposition
Unknown is an operating status
A disposition explains what the business knew at the end of the interaction. Examples include booked, qualified follow-up, not a fit, unavailable capacity, price objection, customer deferred, duplicate, support request, or unknown. Keep the list short enough that staff will use it and specific enough to guide the next decision.
Unknown should trigger review, not shame. It may mean the call record and CRM are disconnected, the staff member was not trained to close the loop, the customer left before qualification, or the business never defined what counts as finished. Track the reason when you can.
Do not turn every no into a follow-up campaign
Some inquiries should close. The service may be unavailable, the location may be outside the real service area, the caller may need a licensed professional the business does not provide, or the request may create unacceptable risk. Respectful qualification protects both the customer and the team.
When a qualified buyer is not ready, a visible follow-up path may be useful. Standard reminders and tasks may fit the Core Protocol. Business-specific sequences, estimate follow-up, reactivation, and multi-channel campaigns often require a Custom Conversion System because copy, timing, exceptions, ownership, and measurement are part of the scope.
Field 5: name the next-action owner
A promise without ownership is a hidden queue
If a caller is told that someone will call, email, quote, verify, or schedule later, the record needs a responsible person or workflow, a due time, and a status. Shared inboxes and mental notes create ambiguity. The customer hears a promise while the business sees no accountable work.
Ownership does not mean one employee performs every step. It means one role is accountable for seeing that the next step reaches completion or a final disposition. If the owner remains the default for every unusual case, the call analysis is also revealing an owner-dependence problem.
Inspect overdue and reopened work
Group promised actions by open, completed, overdue, cancelled, and reopened. Reopened work is especially useful because it may show that the first answer lacked information or authority. Review the path before adding more reminders. Repeated nudges cannot repair a missing decision right.
Field 6: connect the final outcome
Booking is not the only useful outcome
A call may become completed service, a consultation, an estimate, qualified follow-up, a known loss, a support resolution, a referral elsewhere, or an unresolved record. Choose outcomes that reflect the business model. The goal is not to force every interaction into revenue. It is to know what happened and whether the business acted as intended.
When the outcome is lost, use a reason supported by evidence: no capacity, outside service area, service unavailable, customer chose another provider, price, timing, no response, or unknown. Avoid marking competitor won when no one confirmed the customer’s decision.
Protect the data you connect
Call records can contain names, phone numbers, addresses, service details, payment context, health information, and other sensitive material. The Federal Trade Commission advises businesses to take stock of personal information, keep only what is needed, protect it, dispose of it properly, and plan for incidents in its guide to protecting personal information.
Apply that discipline to analysis. Define who may access the export, remove fields that are unnecessary, restrict sharing, set a retention period, and avoid copying sensitive content into casual spreadsheets. This guide is an operating method, not legal advice. Confirm recording, consent, retention, and sector-specific requirements with qualified counsel.
Read the shape only after the definitions are stable
Day and hour distribution
Group eligible inquiries by day and hour. Compare the distribution with published hours, staffing, dispatch capacity, and marketing activity. A peak may reflect real demand, delayed weekend contact, a campaign, weather, seasonality, billing cycles, or a temporary event. The pattern is a question to investigate, not a universal conclusion.
Look for recurring windows where eligible inquiries receive different answer paths or longer useful-response intervals. Then sample the records. If the business cannot explain the difference with capacity, policy, or customer behavior, it has found a decision-worthy gap.
Unanswered and abandoned paths
Separate no answer, voicemail, abandoned before connection, failed transfer, and disconnected calls. These states require different responses. An abandoned call may reflect wait time, an accidental dial, spam, or a customer who found the needed information elsewhere. Follow a representative sample to disposition before estimating opportunity.
Repeat contact
Link repeated phone numbers to journeys while respecting shared household and business lines. Ask whether the second contact was planned, whether the first path resolved the request, and whether staff could see the earlier context. Repeat contact can reveal weak confirmations, missing documents, unclear ownership, or an incomplete answer. It can also be normal.
Call duration as an investigation signal
Duration alone does not measure quality. A short call may be an efficient booking or an abrupt failure. A long call may be careful qualification, a complex complaint, accessibility support, or avoidable confusion. Compare duration with service type, disposition, outcome, transfers, holds, and notes before changing a script or staffing model.
Disposition and handoff gaps
Count how often eligible inquiries lack a disposition, owner, due time, or final outcome. Then locate the exact transition where evidence disappears. Common transitions include phone to calendar, phone to estimator, answering path to office staff, estimate to follow-up, and after-hours intake to next-day operations.
A Smart Website can reduce avoidable phone ambiguity by clarifying positioning, services, fit, intake choices, and booking paths before the call. It does not replace a phone path when customers prefer or require one. The front door works when web, phone, booking, CRM, and follow-up preserve context together.
Run a defensible call-log review
Step 1: write the decision before pulling data
Name the question. Examples: Do after-hours eligible inquiries receive a useful path? Why do qualified estimates return to the main line? Where do new-patient calls lose ownership? Can staff book the right service without asking the owner? A focused question prevents an export from becoming a decorative dashboard.
Step 2: choose a representative sample
Include ordinary days, different hours, multiple answer paths, and both known and unknown outcomes. If seasonality or an event could distort the period, say so. Start small enough to review the actual records. Expand only after the definitions and labels produce consistent decisions.
Step 3: define exclusions and statuses
Write what counts as an eligible inquiry, duplicate, support contact, useful response, booked outcome, unresolved record, and known loss. Share examples with everyone classifying the sample. If two reviewers disagree, improve the definition before reporting a percentage.
Step 4: connect records carefully
Link phone events to CRM, calendar, estimate, or customer outcomes using the least sensitive identifiers needed. Keep a record of uncertain matches. Do not merge different people or journeys simply because a household, office, or property manager shares a number.
Step 5: inspect examples behind every pattern
For each material pattern, read notes, review the timeline, and sample the experience where permitted. Ask what other explanation fits the evidence. A responsible analysis tries to disprove its first story before recommending a system.
Step 6: choose one operating change
Change one meaningful path, define the acceptance scenarios, and compare the same fields afterward. The first move may be staff authority, a calendar rule, clearer website intake, standard platform configuration, a bounded AI receptionist, or a custom workflow. Choose the smallest complete change that protects the customer journey.
When AI belongs in the answer
AI needs an operating boundary
An AI receptionist can be useful when eligible calls arrive during overflow or outside coverage, the allowed service path can be described, and the business has a real escalation and fallback. It should not invent availability, price, policy, clinical advice, legal conclusions, or safety decisions.
The NIST AI Risk Management Framework organizes AI risk work around Govern, Map, Measure, and Manage. A service business can translate that into practical controls: named ownership, documented purpose, tested scenarios, monitored outcomes, incident handling, and continuing review.
Test the handoff, not only the conversation
A natural conversation can still fail if the record is incomplete, the calendar rule is wrong, the urgent call reaches nobody, or staff cannot see what happened. Test ordinary requests, unavailable capacity, repeat callers, sensitive situations, interruptions, silence, poor connections, and requests outside the approved scope.
Our AI receptionist implementation guide explains the customer-facing role. A broader AI Business OS connects phone, website, booking, CRM, reviews, and follow-up when the business needs shared context across the front door.
A bounded first-party observation
In one pest-control engagement, the client’s own records showed recurring after-hours contact and unstructured intake. We reorganized the questions, handoff, and follow-up around the actual customer journey. The team spent less time reconstructing context and could use more of its available time for owned follow-up.
That is a first-party operating observation from one engagement. It is not a promise that another company has the same pattern or will produce the same result. The transferable lesson is the method: inspect the client’s records, define the path, repair the failure, and verify the outcome in the same system.
See the evidence approach and case studies for how we separate customer observations, measured results, and directional planning models.
The decision
Do not buy a phone feature because a generic benchmark made the problem sound expensive. Build the smallest honest record that connects eligible inquiry, answer path, useful response, disposition, ownership, and final outcome. Then let the evidence choose the first move.
If the pattern points to staff authority, repair the rule. If it points to standard coordination, configure the platform. If buyers cannot understand or choose the right path, improve the website. If phone coverage has a safe repeatable boundary, test AI intake. If the journey crosses custom logic and channels, scope the complete system.
A Systems Review starts with the evidence you already have and separates the software available from the work that must be designed, configured, tested, and operated.
The practical questions behind this decision.
How many call records do I need?
Use enough records to include the days, hours, services, staff, and answer paths relevant to the decision. Begin with a reviewable sample rather than a huge export. If the definitions hold and a pattern persists, expand the period. State the sample and its limitations.
What if my call volume is low?
Low volume makes percentages unstable, so inspect individual journeys and use counts. A handful of well-documented inquiries can still reveal missing ownership, a failed transfer, unclear qualification, or a booking rule. Avoid turning one unusual week into a broad conclusion.
Do I need call-tracking software?
Not to begin. A phone export, calendar, CRM, estimate records, and staff notes may be enough for a sample. The first requirement is consistent definitions and a final disposition. Better tooling becomes valuable when manual linking is unreliable or the review needs to continue.
What is a useful response?
It is a response that advances the customer toward an honest next step: booking, qualification, routing, approved guidance, a truthful callback window, a request for necessary information, or a respectful decline. A ring event or generic acknowledgement is not automatically useful.
Should every missed call receive an automated text?
No. The business should consider consent, context, number type, customer expectation, applicable rules, and whether the text creates a real owned path. A standard missed-call response may help in some environments, but it should not claim availability or create a promise the team cannot fulfill.
Does a long call mean the intake process is inefficient?
Not by itself. Duration needs context from service type, customer need, hold time, transfers, disposition, and outcome. Use it to select examples for review. Do not set a universal ideal length or reward staff for rushing a customer.
How do I calculate missed-call revenue?
First classify eligible inquiries and follow a representative sample to known outcomes. Use your own booking, average completed value, capacity, margin, and repeat-value records. Keep unresolved contacts separate and label assumptions. Do not multiply every unanswered ring by an average sale.
When is a custom system justified?
A custom system is justified when the valuable customer journey requires business-specific qualification, multiple channels, routing logic, campaigns, integrations, exceptions, reporting, and continuing improvement. If the failure is a missing staff rule or standard configuration, solve that first. Review pricing and scope boundaries before assuming the monthly plan includes strategy, copy, campaign design, or custom build work.
What should I bring to a Systems Review?
Bring a redacted call export, answer-path labels, examples of missed or repeated contact, current calendar rules, pipeline stages, follow-up messages, capacity constraints, and any journey where the owner or team must reconstruct context. Do not send sensitive customer information before the review process defines a safe method.
Connect one customer path before adding more disconnected tools.
The first useful system owns a defined journey from customer action to team handoff and follow-up.

Vikram Roy is the founder of The Quiet Protocol, a Toronto-based systems firm serving service businesses across the Greater Toronto Area, Canada, and the United States. He works directly with professional firms, home service companies, dental practices, clinics, and local businesses to connect websites, customer intake, booking, reviews, follow-up, and practical AI into a clearer digital front door. All content is written from Toronto, Ontario. See the editorial method →
See where a website, platform launch, AI intake path, or Custom Conversion System fits before committing to a scope.
See how the capability in this article fits into a complete customer journey.
Service BusinessesSee the same decision through the language, buyer behavior, and operating reality of this industry.
Client Results & ProofInspect the starting condition, installation, measurement window, and outcome behind real client work.
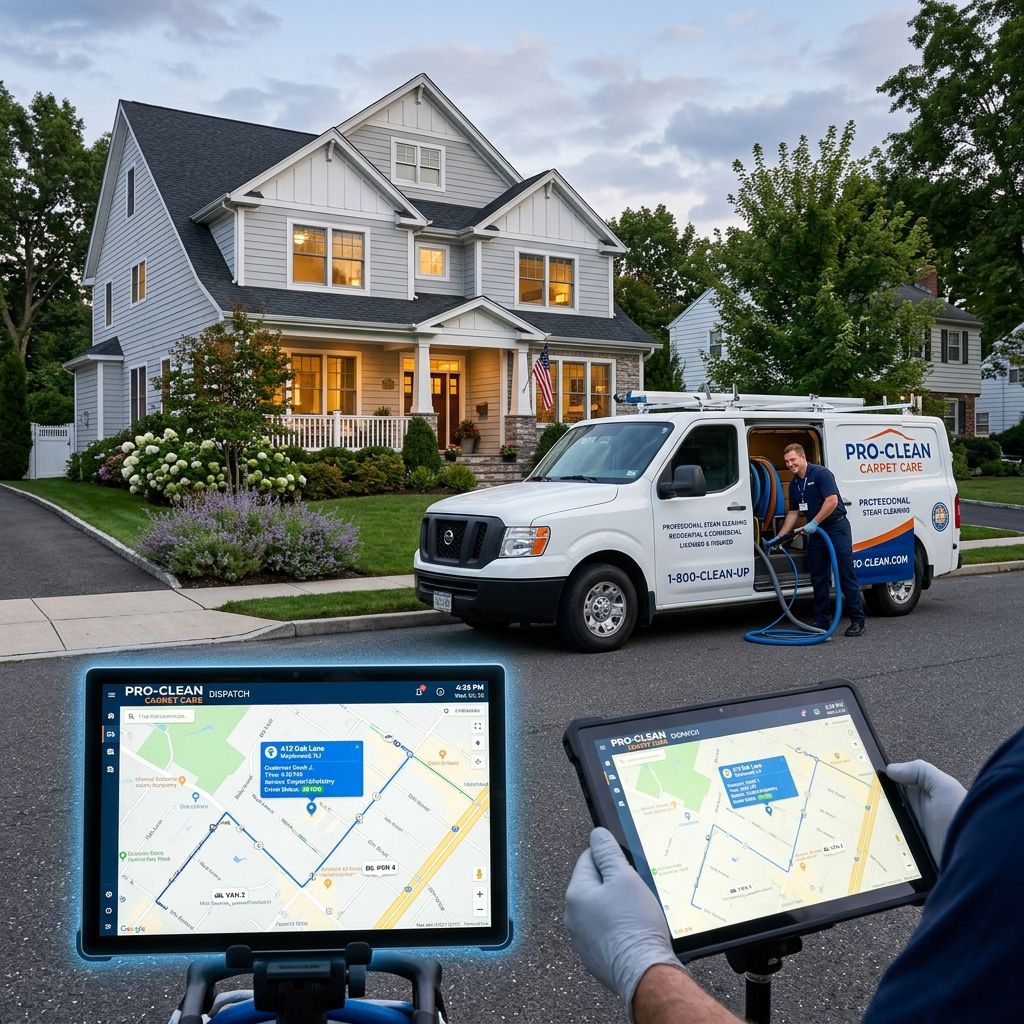
Carpet Cleaning Businesses Win on Speed. Here's Why Your Intake Is the Bottleneck.
A carpet cleaning field guide to missed calls, same-day booking, dispatch notes, CRM handoff, and follow-up when speed decides the job.

Commercial Cleaning Companies Win Bids They Never Close. Here's the Leak.
How commercial cleaning companies can close more walkthroughs and bids with faster follow-up, cleaner CRM notes, proof, and renewal-ready communication.

The Formula That Tells You Whether Your Marketing Is Actually Working
A practical CAC, LTV, call conversion, and review-driven ROI guide for owners who need to know whether marketing is really working.